Intel CPU Die Topology
Over the past 10-15 years, per-core throughput increases have slowed, and in response CPU designers have scaled up core counts and socket counts to continue increasing performance across generations of new CPU models. This scaling however is not free. When scaling a system to multiple sockets using NUMA (Non-Uniform Memory Access), software must generally take the NUMA topology and locality into account.
However, there is a second level of locality present in more recent, high core count systems which many overlook. To scale to higher core counts, these high core count CPUs implement a Network-On-Chip (NOC) interconnect within each physical CPU die and package, typically some sort of mesh or ring bus, to communicate between CPU cores (or more precisely, between L3 cache slices and L2 + L1 caches associated with each core) on the same physical CPU die. Depending on the particular topology used for the network, the interconnect will have varying performance characteristics.
For most applications and CPUs, these performance differences will be negligible in practice for all but the most demanding workloads. However, they are detectable with microbenchmarks. And moreover, certain CPU models do have noticeable performance impacts at the application level if the non-uniformity in communication costs between cores on a physical CPU package is neglected.
To begin, we’ll look at a pair of Intel CPUs, and observe a few key details on their on-die interconnect topology and impact on cross-core communication patterns. In a subsequent post we’ll take a look at AMD Rome and AMD Milan CPUs, and their much more nuanced hierarchy.
Measurement Methodology
All measurements are performed on bare metal EC2 instances running in AWS. Bare metal whole host instances were used to avoid interference from co-located workloads on the same host given the sensitive nature of these measurements. You can find the tool used to perform these measurements on Github here: https://github.com/jrahman/cpu_core_rtt.
Intel Monolithic Topology
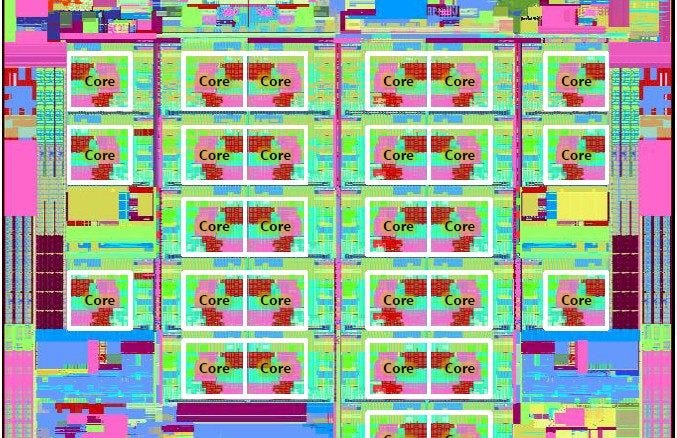
The Intel CPUs we’ll take a look at today are both monolithic dies with 24 to 32 cores per CPU socket. The diagram below shows the general layout for these dies:
A few points to note. The mesh interconnect is clearly shown in the diagram. Each CPU core (including both Hyperthreads) has a Caching and Home Agent (CHA in Intel documentation). The L3 cache for the die is divided into multiple “slices”, with one slice attached to each CPU core. The L3 cache slice attached to a core is not exclusive to that particular CPU core. Rather, any CPU core on the same physical die has equal access to any L3 cache slice elsewhere on the die by sending messages over the mesh interconnect. The CHA is connected to the mesh interconnect as a network stop. Accesses to the L3 slice are from other CPU cores mediated through the Caching/Home Agent, as are outbound messages from the attached CPU cores.
With that conceptual background out of the way, let’s look at a couple examples of the mesh interconnect’s performance.
Cascade Lake
First up, our dual socket Cascade Lake system. This particular system is a c5.metal AWS instance with two 24 core (48 thread) Xeon Platinum 8275CL CPUs. The 24 core Cascade Lake SKUs running in AWS are based on the XCC die, nominally with 28 cores, but running with 4 of those cores fused off (likely for yield and TDP reasons).
The diagram above shows the mesh topology used in the Cascade Lake XCC die. The worse case for core-to-core communication would be a 18 hop round trip between CPU cores on opposite corners of the silicon die.
The heatmap clearly shows a some key details. First, the NUMA cost is clearly apparent. The orange/red/yellow squares represent pairs of cores on different NUMA nodes. There is at least a 5-10x penalty when communicating with a CPU core on a different NUMA node. And this is one a dual socket system with only a single NUMA hop. Higher NUMA factor systems can incur multiple node hops.
We also see the Hyperthreads show up as the blue diagonals. Those CPU cores communicate through a shared L1 cache, instead of communicating across the mesh interconnect within the CPU die, or across the UPI interconnect between CPU sockets.
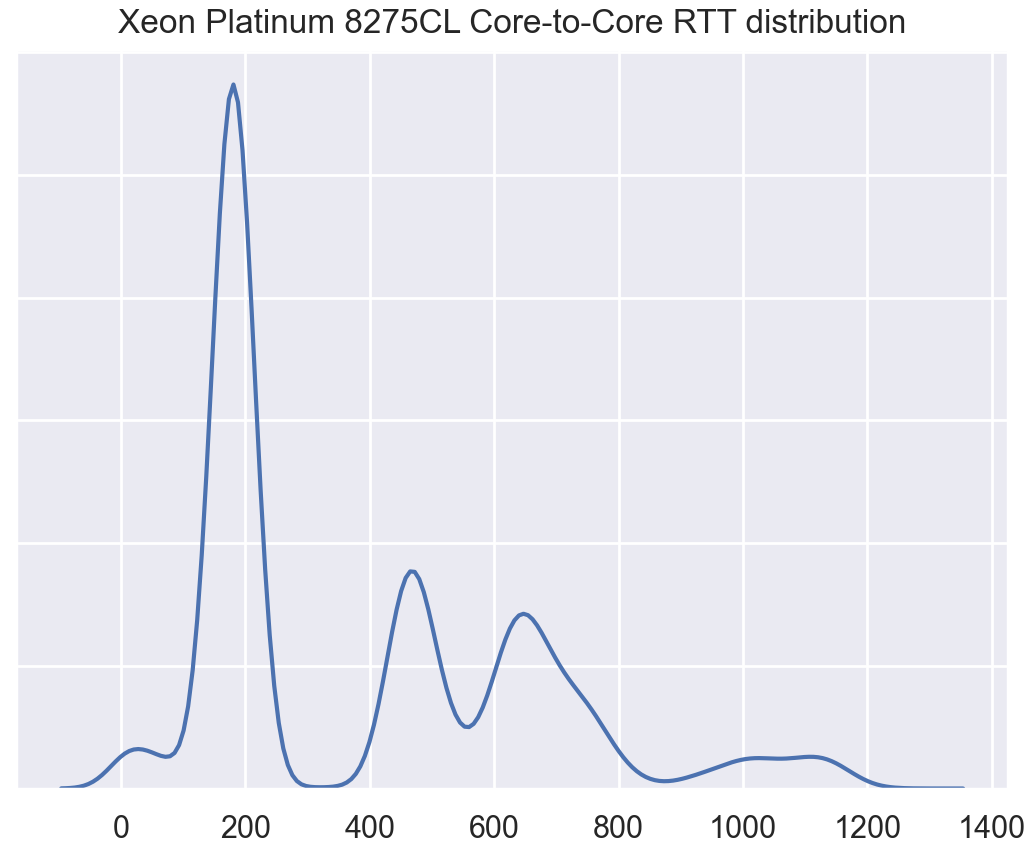
The histogram show a few different modes, a small peak at the far left edge is from the low latency RTT between Hyperthreads on the same physical CPU core, while the primary peak around 200 ticks represent on-die communication through the ring interconnect. The rest of the peaks reflect cross NUMA node over the UPI cross-socket interconnect.
Ice Lake
Next up, we have a dual socket Ice Lake system. This is a AWS c6i.metal host running dual Xeon Platinum 8375C CPUs, each with 32 physical CPU cores and 64 hyperthreads for a total of 64 cores + 128 threads.
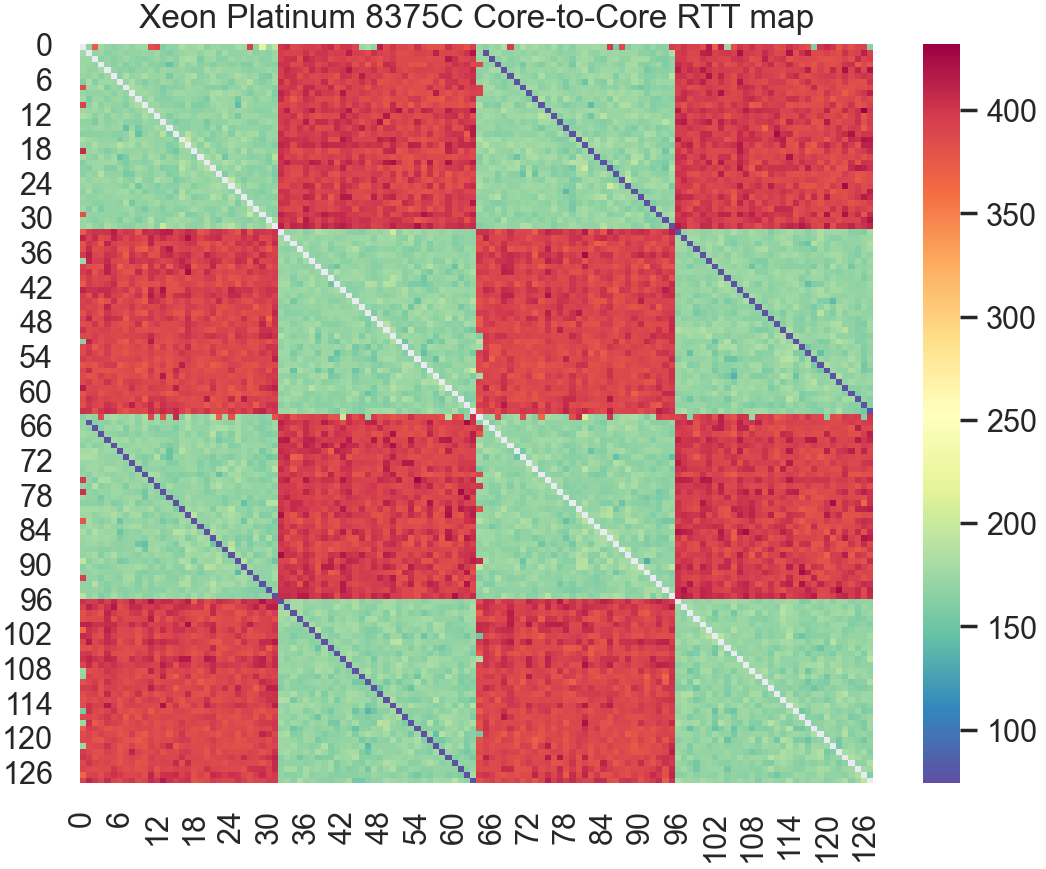
The latency heatmap already shows a very flat and consistency latency profile. Just like the Cascade Lake data, we observe the Hyperthread pairs show up as partial diagonals. While the separate NUMA nodes show up clearly. Green squares reflect RTT time between cores on the same NUMA node, while longer RTTs between CPU cores running on different NUMA nodes show up as higher RTT red squares.
The above histogram also shows the clear triple peak, revealing, from left to right:
Low hyperthread to hyperthread RTT around ~50 ticks
Within die mesh interconnect RTT around 175 ticks
Cross NUMA node UPI interconnect RTT around 400 ticks
Compared to Cascade Lake, we see from both the histogram and the latency heatmap, that Ice Lake has tightened up the latencies between cores within the same die. While some of the differences here may be measurement noise, it appears that after a few generations using a mesh interconnect (starting with Skylake) Intel has clearly been making solid generation over generation improvements.
Conclusions + Next Round
We’ve seen the fairly flat latency profile which Intel’s on-die mesh interconnect yields. While the histograms do reveal some amount of variance in communication cost, that variance is quite low, and newer generations have fairly predictable and flat latency profiles across the CPU die. For practical purposes, on Intel CPUs, nearly all software can treat the communication cost across cores as both uniform, and low enough to generally not show up as a performance issue.
Next up we’ll cover AMD CPUs, both Rome (Zen 2) and Milan (Zen 3), which (spoiler) do have noticeable variation in communication costs within a CPU package.


Great work!
Thank you for this interesting article. The Cascade Lake heatmap has horizontal and vertical lines for virtual cores 0 and 64 that are mostly green. This means whenever virtual cores 0 and 64 communicate with any other virtual core, the measured round trip time is usually around 200 time units. It is as if virtual cores 0 and 64 rarely do any inter-socket communication. Does anyone have a guess about what could cause this or how to debug it?
If hyperthreaded siblings are ignored, we can just look at the upper left 1/4 of the Cascade Lake heatmap. In the upper left 1/4 of this heatmap, the two squares for inter-socket communication (upper right and lower left) are different colors. This means inter-socket communication starting from one processor socket has a different measured round trip time than inter-socket communication starting from the other processor socket. Can anyone suggest a reason why this would occur?
When Jason Rahman used the same software with Ice Lake and Sapphire Rapids, the inter-socket round trip time did not depend on which processor socket it started from. The Cascade Lake that was used had 24 physical cores per socket, while Ice Lake had 32 physical cores and Sapphire Rapids had 48 physical cores. One way to check if the number of physical cores being tested changes the software behavior would be to run the same test on Ice Lake but only use 24 physical cores per socket.
To do this, after line 178 (the idx for loop), insert this line:
if (idx % 32 > 23) continue;
After line 180 (the jdx for loop), insert this line:
if (jdx % 32 > 23) continue;
The lines above skip measurements when either idx or jdx are in the range [24,31] or [56,63] or [88,95]. The cores variable would be set to 120, instead of 128, since measurements are not wanted for idx or jdx in the range [120,127]. These changes would allow running a test on Ice Lake, but using only 24 physical cores per socket to check if this changes the software behavior (that is, check if it makes the inter-socket round trip time depend on which processor socket starts the communication).
Another puzzling thing about the Cascade Lake heatmap is the significant amount of blue area in half the squares for inter-socket communication. It seems extremely unlikely that inter-socket communication on Cascade Lake is ever faster than intra-socket communication, based on the gap between the two peaks in the Ice Lake round trip time (RTT) distribution. Therefore, the blue areas in the inter-socket squares of the Cascade Lake heatmap seem like a bug. The RTT distribution for Cascade Lake shows a small peak between 900 and 1200 time units. There is only one dark red pixel in the Cascade Lake heatmap corresponding to this peak from 900 to 1200 time units. The small peak at 50 time units is visible in both the RTT distribution and heatmap (2 diagonal blue lines), but the much wider peak between 900 and 1200 time units is almost completely invisible in the heatmap. These large time values and/or some other RTT values might be treated as overflowing to negative numbers somewhere and Seaborn's heatmap would clamp the negative numbers to zero (dark blue).
Getting three different peaks (centered at 475, 650 and 1050 time units) when one peak is expected is somewhat similar to the three rightmost peaks that Jason Rahman measured for the Sapphire Rapids RTT distribution. Whatever is splitting one peak into three peaks on Cascade Lake might be doing the same thing on Sapphire Rapids. It should be easier to figure out what is happening on Cascade Lake than Sapphire Rapids because the run time is 1/4 as much, Cascade Lake is a monolithic die (no chiplets) and Amazon has a bare metal instance for Cascade Lake.
I don't know if this is just a coincidence, but on Cascade Lake, the difference in time between the 650 and 475 peak in the RTT distribution is equal to the center of the intra-socket peak: 650 - 475 = 175. So the peak centered at 650 time units is acting like the peak centered at 475 time units plus one intra-socket round trip time. Similarly, the Sapphire Rapids RTT distribution showed peaks at 550 and 425 with the intra-socket peak at 125, which has the same pattern: 550 - 425 = 125. It is as if inter-socket communication causes a cache line to sometimes do one extra bounce between caches within a processor socket, which would be a hardware performance bug. The CPU performance counters might indicate if this is really happening. On Cascade Lake, you would look for more intra-socket cache traffic when doing inter-socket communication starting in one processor socket compared to when doing inter-socket communication starting in the other processor socket. One way to check for this is to insert the line below after line 180 (the jdx for loop):
if ((idx/24)%2 == (jdx/24)%2) continue;
The line above skips all virtual core pairs in Cascade Lake that are both in the same processor socket. The cores variable could be set to 27 or 30, instead of 96, to make the code run 32x or 16x faster. You should check that a heatmap shows the same inter-socket round trip times as before making these changes. When running the code with these changes, if a graph of intra-socket cache traffic shows a difference between the first and second half of the run time, that would indicate that this difference depends on which socket the inter-socket communication starts from. In other words, it would indicate a hardware performance bug.
Here are some other ideas for investigating the issues described above:
1. Check if any of the round trip times used to create the Cascade Lake heatmap are negative.
2. Set the Seaborn heatmap vmax parameter to 1200 to increase the upper limit of the colormap in the Cascade Lake heatmap and check if that reduces the amount of dark blue areas in the heatmap, which would indicate a bug in Seaborn.
3. Run the test twice and check if the location of the dark blue areas change in the Cascade Lake heatmap.
4. Pass idx into the client function and print an error message if rtt < 100 && abs(idx - core) != 48. This would also be an interesting place to set a breakpoint. Two threads are hyperthreaded siblings on Cascade Lake when abs(idx - core) == 48 so that case is excluded.
5. Print an error message if any of the pthread functions, especially pthread_setaffinity_np, returns a nonzero value. This indicates an error.
6. In both the client and server functions, print an error message if core != sched_getcpu().
7. Print an error message if the ring buffer is not completely filled with new values before exiting the client function. To do this, at the top of the client function, save the initial value of data.idx. When exiting the client function, print an error message if the final value of data.idx is not at least 64 more than the initial value.
8. Try experimenting with different amounts of padding1 and padding2 on lines 56 and 59. One option is to remove padding 1 and use 48 bytes for padding2. This would put the two 64-bit values in one cache line. When a core stores one 64-bit value, the cache line would be invalidated in the caches for all other cores and the cache line would be copied when one of these other cores loads the 64-bit value. The sequence would be:
* client does store invalidating cache line in server
* server does load copying cache line from client
* server does store invalidating cache line in client
* client does load copying cache line from server
9. Make a list of virtual core pairs that have a round trip time of between 900 and 1300 time units and see if this list changes when the test is repeated.
10. Set a breakpoint in the client function when rtt is calculated to be negative or more than 900 time units and check the variables to see if the calculation is being done correctly in this situation.