Sapphire Rapids Core-To-Core Latency
In my previous post, I covered the latest generation of AMD CPUs (Rome + Milan). Now that AWS has released Sapphire Rapids M7i instances to GA, I’ve finally gotten my hands on some (expensive) EC2 instance time with a Sapphire Rapid CPU. As a foreword, the analysis here is fuzzier due to a couple factors:
Was only able to reserve a m7i.48xlarge instance, rather than a bare metal host (thus hypervisor overhead/interference is possible)
My statistical analysis on various latency overheads in the system does lack whitebox datapoints from actual performance monitoring counters
I consider the blackbox analysis here as a jumping off point for a more principled whitebox analysis on the overhead of EMIB. Comments/feedback on directions for that welcome!
AWS Exclusive
Reserving a m7i.48xlarge instance I got to work. This particular Sapphire Rapids CPU reports itself as a Xeon Platinum 8488C:
Searching through Intel ARK, there is no such publicly described SKU, which means this Xeon is a custom part designed specifically according to AWS’s particular requirements. Given AWS’s volume, and known customer profiles, the existence of a custom SKU here is not at all surprising. Azure, GCP, and AWS all have deep enough pockets and a large enough set of orders to justify Intel blowing a different set of fuses to create custom SKUs.
Intel’s Path To Scaling
As we discussed previously, AMD took the more aggressive tact and introduced a chiplet based architecture with multiple physical dies per socket lashed together with an on-package interconnect. My previous coverage and general industry experience demonstrated a palpable performance hit when communicating between CPU cores running on different dies. While the hit is lower than the traditional performance penalty experienced on true multi-socket NUMA machines, the performance cost is still far from trivial. AMD knew this full well and subsequent generations of AMD Zen CPUs optimized the physical topology to minimize the amount of data which needed to be transfers (increasing the size of CCDs/CCXs to avoid x-chiplet communication on fewer core pairings) and improved the latency on the underlying interconnect layer.
With that in mind, Intel has taken a longer time to move to a chiplet based approach. Initially Intel remained on a more conservative path, fabricating larger monolithic dies sporting lower core counts per socket. However, the physical limits of chip manufacturing equipment mean Intel is now forced to either shrink the physical core and cache sizes (and suffer a loss of single threaded performance through a simpler core design), or succumb to the reality they must disaggregate cores into multiple dies.
EMIB
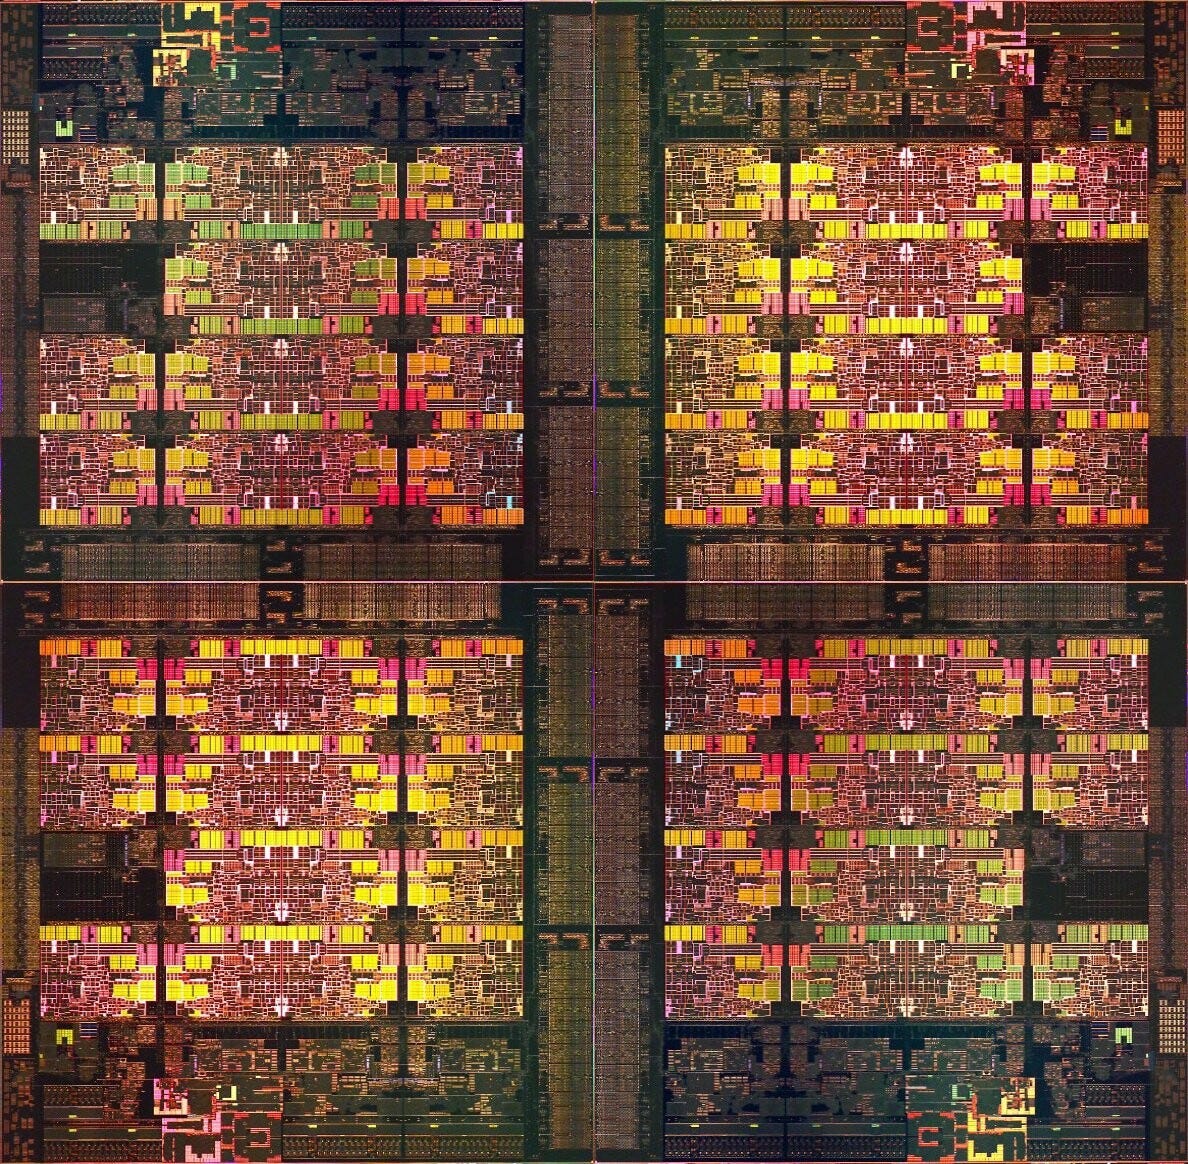
To that end, Intel has for the first time with Sapphire Rapids adopted their EMIB interconnect technology for mainstream server products. For high core count variants, Sapphire Rapids has now adopted Intel’s EMIB technology to integrate 4 separate chiplets into the same physical package:
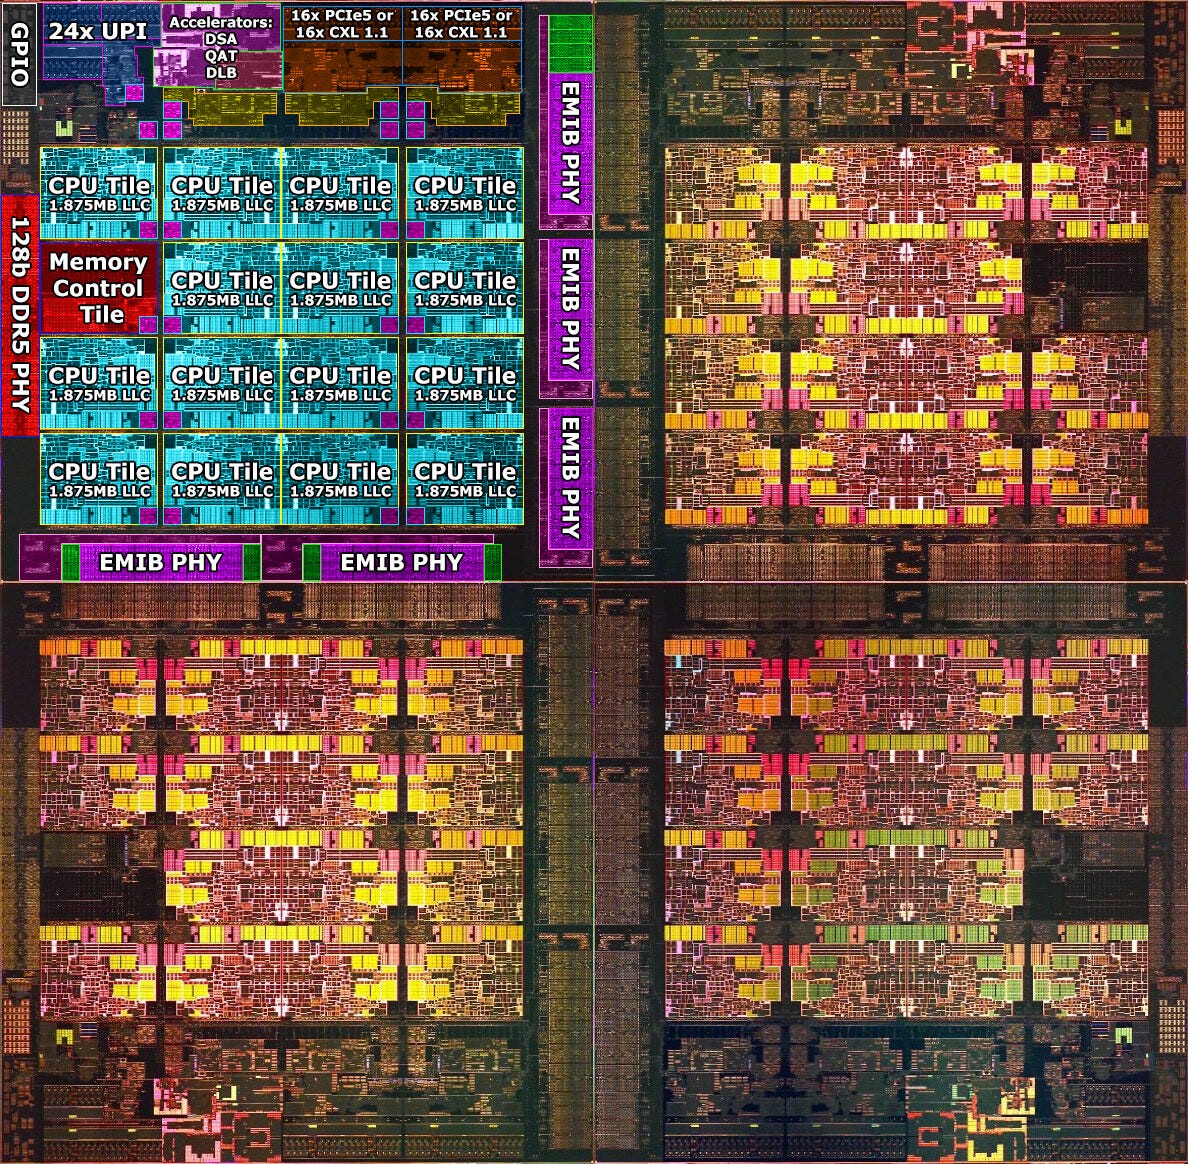
Each Sapphire Rapids package is comprised of multiple dies connected to one another using the EMIB interconnect. Within each die are up to 15 CPU cores, each connected within the same physical die using the mesh interconnect from previous monolithic dies, such as Ice Lake. The diagram below shows the entire physical package with one of the dies annotated:
The EMIB phy bridges are scattered around the edges of each die to provide interconnection with the adjacent dies. The implication here is that Sapphire Rapids has a more hierarchal design than Zen. Depending on which cores are communicating, either 0, 1, or 2, EMIB links must be traversed in each direction within a package. This is in contrast to Zen where either 2 links are traversed in each direction (CCX/CCD → IO die → CCX/CCD) or no links are traversed (within the same CCX/CCD).
Another implementation detail worth noting here is that each of the 4 dies per Sapphire Rapids package has its own UPI interconnect. However, in this 2S system, only 1 UPI link is active per package. Thus, depending on which die in each package is running the UPI link between sockets, there will be a variable amount of latency to even reach the UPI link. The worst case latency in the system will be experienced by CPU cores pairs where each core is on a die in the package which is 2 EMIB hops away from the die hosting the UPI link tile.
Measurements + Initial Observations
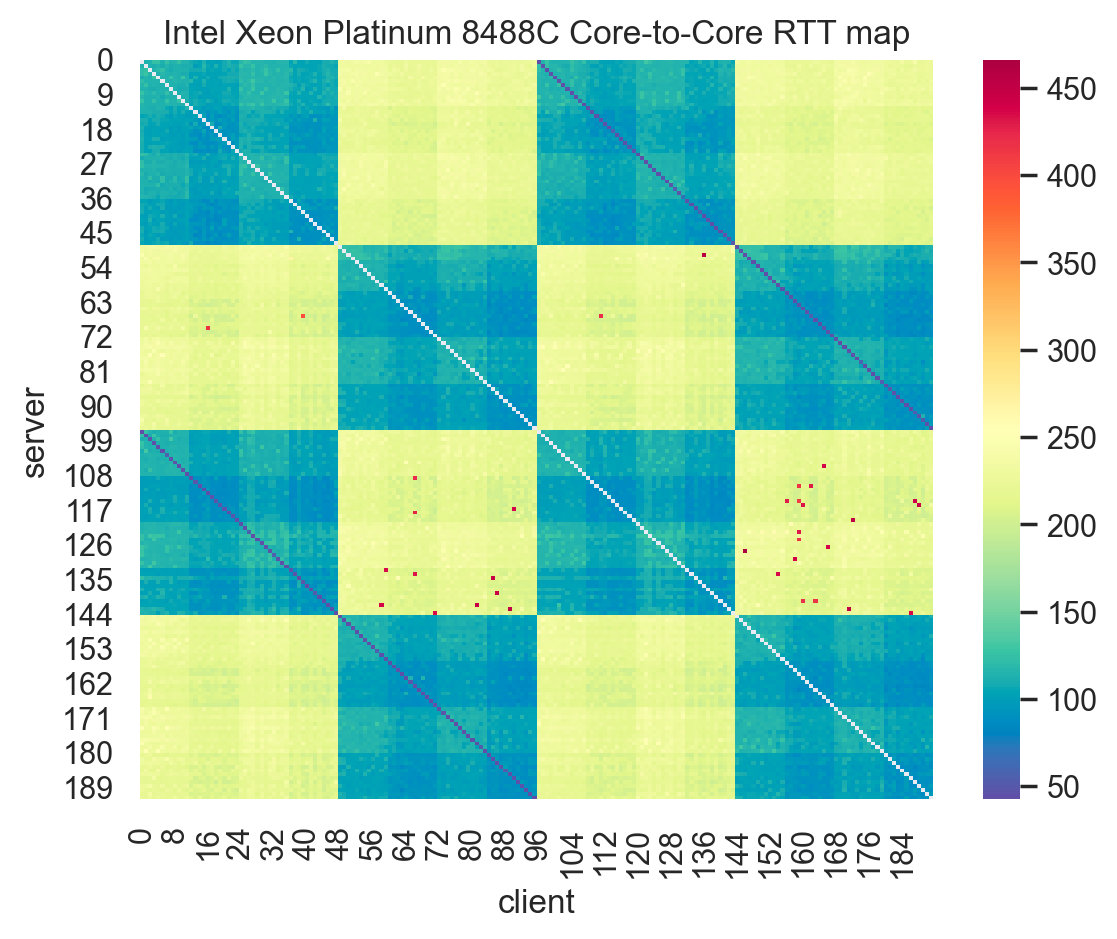
With those preliminaries out of the way, let’s take a look at the data collected from our 48 core Xeon Platinum 8488C CPU running in a (very expensive) dual socket M7i EC2 host:
First up, we have our full system latency map. Here I’ve normalized the latency measurements to nanoseconds (previously I kept the scale defined in rdtsc() ticks). The typical NUMA socket pattern shows up rather clearly. Cores on the same NUMA node are closer and thus communicate more cheaply. Opposite for CPU cores on different NUMA nodes. Hyperthreads sharing a physical CPU core show up neatly as the blue semi-diagonal lines. So far, this is pretty standard compared to Ice Lake (below):
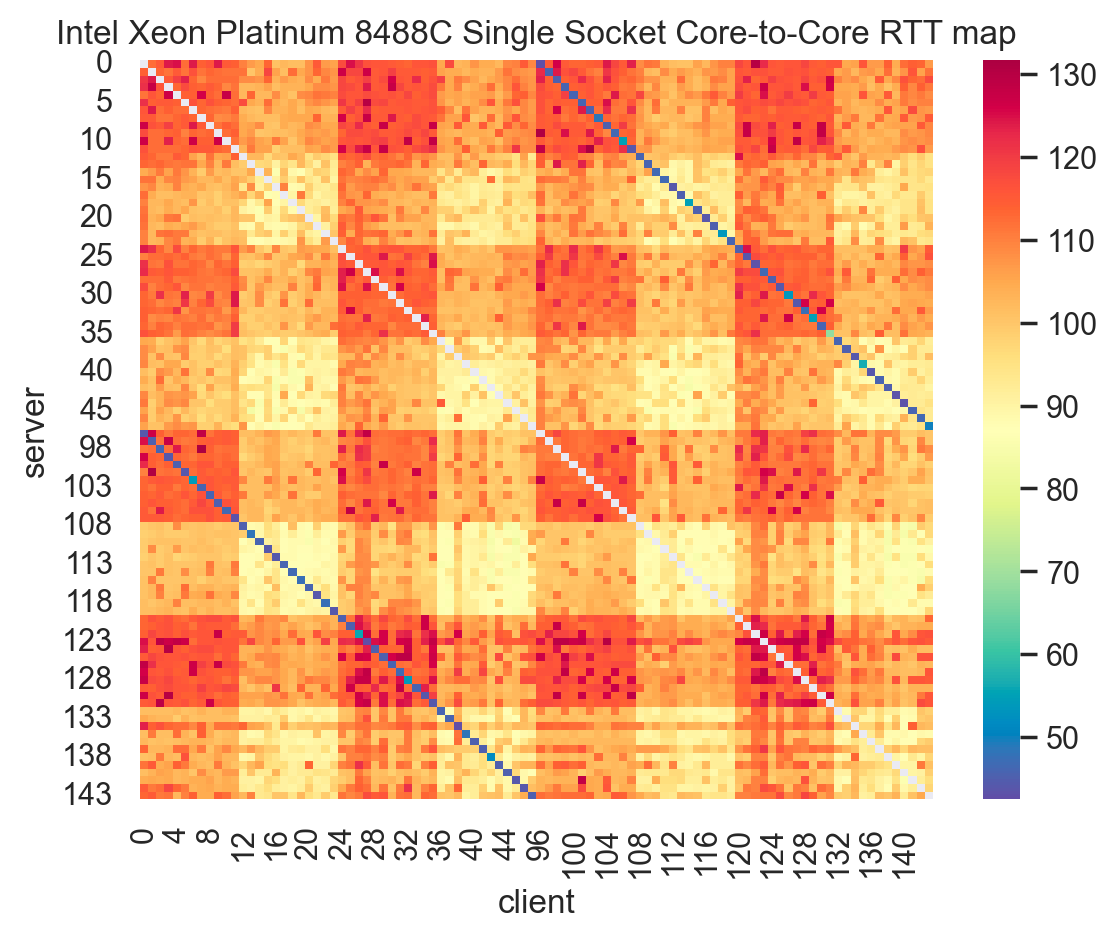
There is however something interesting which shows up in the latency map which was not present in the previous Ice Lake CPUs (as seen above). In the Ice Lake CPU, the latency across each sub-box representing in-NUMA node pairs vs. out-of-NUMA node pairs is fairly uniform. Ie, the mesh interconnect has a (relatively) uniform latency distribution. However, for Sapphire Rapids we see a non-trivial amount of core to core latency variation within a physical package. Zooming in to a single NUMA node, we have the below latency map:
Unlike Ice Lake and earlier, there is quite a significant amount on non-uniformity within this NUMA node. In fact, the latency map here looks closer to the Zen latency maps we’ve seen before. This appears to be part of the effect of the EMIB implementation. Let’s pull up a histogram over full system latency data across both sockets:
In the above data we see 6 primary modes (though some minor nodes can also be see at ~625ns + ~825ns):
~50ns
Hyperthreads on the same physical CPU core, we’ll ignore this mode going forward
~125ns
~225ns
~425ns
~550ns
~750ns
Latency Analysis + Modelling
To break down the costs of EMIB hops, UPI hops, and the underlying cost of the mesh interconnect within each die, we undertake a differential analysis. First up, Hyperthreads on a single physical core require 50ns for round trip times. We consider that as a fixed cost from the software measurement and the baseline overhead to communicate across cores. Secondly, within a single socket, the distribution of 0, 1 or 2 EMIB hops is as follows:
0 hop → (24*22)*4 → ~2112 pairs (~25%)
1 hop → (24*24)*2*4 → 4608 pairs (~50%)
2 hop → (24*24)*4 → ~2304 pairs (~25%)
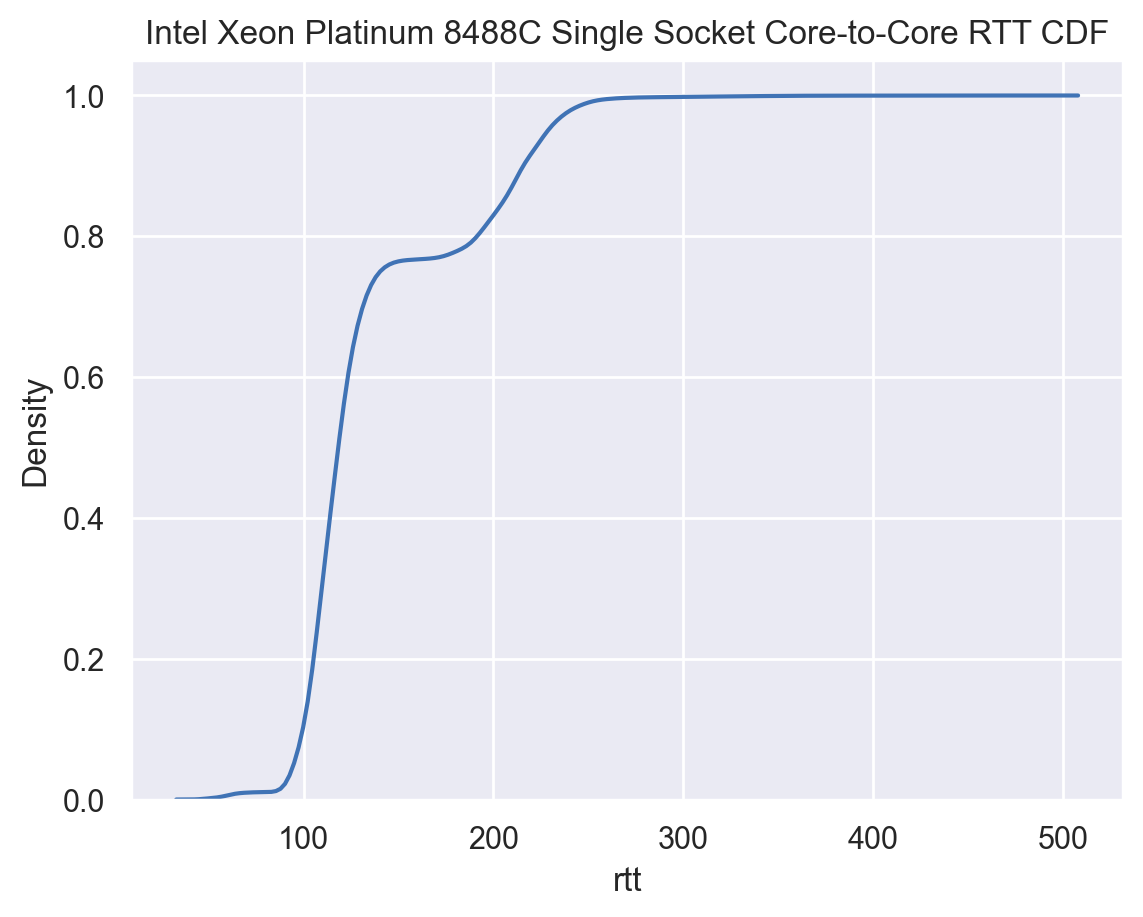
Looking at a single socket CDF over single socket core pair latency we find:
The 75ns-150ns mode accounts for ~75% of core pairs, while the 175ns-225ns mode accounts for the remaining 25% of core pairs. Given the above CDF and the distribution of core pairs with each hop distance, this strongly suggests that the 0-1 EMIB hop costs (~75% of intra socket pairs) fit the 75-150ns mode, while the 2 EMIB hop costs fits the ~175ns-250ns mode. The variation within each latency distribution mode likely stems from intra-die mesh interconnect cost variation (based on the distance of the core on the mesh to the EMIB phy).
That works out to: 50ns base cost + N mesh cost = 75ns → mesh cost ~= 25ns-50ns (mesh cost within a die has variability based on different path lengths within the mesh). These numbers mesh well (pun intended) with measurements on Ice Lake from previous studies.
Next, looking at the 1 EMIB case: 50ns base cost + 25ns mesh cost (source die) + 25ns mesh cost (destination die) + N EMIB cost = 150ns → EMIB cost = 50ns. Here the data does seem to suggest a 50ns penalty to take a EMIB hop within a package. Finally, the 2 EMIB case works out to: 50ns base cost + 25ns mesh cost (source die) + 2*50ns EMIB cost + 25ns mesh cost (destination die) = 200ns. This does approximately match the distribution seen from testing, providing additional support to the cost model so far. Furthermore, it also strongly suggests that Intel implemented a mesh interconnect bypass for the 2 EMIB hop case within a CPU package (since there is no 25ns mesh cost for the intervening die).
The two groups of modes in the 50ns-225ns range are from core pairs within the same package, while the upper set of modes from 400ns-850ns are cross NUMA node core pairs. Given the 300ns gap between the lower mode in each grouping, it stands to reason the penalty to traverse the UPI (NUMA) link is ~300ns (the uppermost modes in the second group are associated with core pairs which had multiple EMIB hops within their respective dies + a UPI hop, including the 4 EMIB hop case between cores in the farthest dies in the 2S system). This is a little perplexing given the UPI cost was so much lower in Ice Lake, so unfortunately I do not yet have a great explanation here.
Matching the above differential analysis with the set of all possible paths through the systems, we arrive at the following cost estimates:
0 EMIB hops
50ns base cost + 25ns mesh cost → 75ns (matches observations)
1 EMIB hop
50ns base cost + 25ns mesh cost + 50ns EMIB hop + 25ns mesh cost → 150ns (matches observations)
2 EMIB hops
50ns base cost + 25ns mesh cost + 50ns EMIB hop + 50ns EMIB cost + 25ns mesh cost → 200ns (matches observations)
1 UPI hop
50ns base cost + 25ns mesh cost + 300ns UPI hop + 25ns mesh cost → 400ns (matches observations)
1 UPI hop + 1 EMIB hop
50ns base cost + 25ns mesh cost + 300ns UPI hop + 50ns EMIB hop (within either package) + 25ns mesh cost → 450ns
1 UPI hop + 2 EMIB hops
50ns base cost + 25ns mesh cost (source die) + 300ns UPI hop + 2*50ns EMIB hops + 25ns mesh cost → 500ns (doesn’t match observations well)
1 UPI hop + 3 EMIB hops
50ns base cost + 25ns mesh cost (source die) + 300ns UPI hop + 3*50ns EMIB hops + 25ns mesh cost (destination die) → 550ns (matches observations)
1 UPI hop + 4 EMIB hops
50ns base cost + 25ns mesh cost (source die) + 300ns UPI hop + 4*50ns EMIB hops + 25ns mesh cost (destination die) → 600ns (does not match observations, should be ~750ns)
Overall, the above model approximately matches the above distribution and various modes, but does not entirely match the full set of modes in the distributions. Notably, the higher values, around 750ns+ do not neatly fit into the above cost model. It’s entirely possible (in fact, likely) the above model is too simplistic and neglects additional higher order costs which contribute additional latency for the longest paths in the system. Given personal time constraints on my end, I’m unable to dig more deeply and need to defer a further investigation into these costs (using performance counters and other tools) for a later time.
Conclusions + Implications
With EMIB, Intel has joined the chiplet club for mainstream server CPUs (Intel used EMIB based chiplet packaging for FPGAs and Foreveros stacking on low power Lakefield client CPUs). EMIB adoption in Sapphire Rapids enables Intel to rejoin the core count war and scale up to 60 core per socket in their halo SKUs. However, while EMIB does appear to be a fairly well optimized interconnect, it is neither free nor transparent from a performance point of view. Adding additional circuitry and physical distance across the CPU package to traverse, EMIB will incur a penalty when communicating between cores on different dies within a package.
Based on absolute latency values, and assuming our breakdown for the cost of each hop, it would appear the penalty for an EMIB hop alone is about 16% of the cost of a UPI hop (50ns vs. 300ns), but additional mesh hops at the source and destination dies will add additional cost. All in all, not as painful as the chiplet interconnect in AMD Zen. Also, my initial take when I saw lack of all-to-all EMIB die interconnections on each package (implying the existence of the 2 EMIB hop intra-socket path) was concern about the hit latency would take for the 2 EMIB hop case case. It appears Intel did work to minimize that hit through some level of bypass around the mesh interconnect within the intervening die.
In spite of these latency costs, I’d imagine for many workloads, EMIB won’t be a significant issue. These high core count CPUs normally find their way into servers at hyperscalers, who then carve up those servers into much smaller VMs. With Amdahls law in effect punishing highly parallel workloads and VM packing in play, many workloads will never span more than 1 die, much less 1 physical socket. As such, workloads which would experience the most significant performance impact must both:
Scale up to the entire package/pair of sockets
Exercise tightly coupled concurrency with frequent core-to-core communication
Not many workloads tick both of these boxes (the combination of the two factors was already a known scalability risk, so software tries to avoid this “devil’s corner” of behavior). Therefore, so long as the majority a workload is kept bound to 1-2 Sapphire Rapids dies, the impact is likely minimal in practice.
It’s interesting to note that with the upcoming Emerald Rapids die shrink on Sapphire Rapids, Intel is actually somewhat back-tracking from chiplets (at least temporarily for ER), scaling back from 4 → 2 chiplets. I’d expect with ER undergoing 2 → 4 die reduction from Sapphire Rapids, combined with improvements to the EMIB interconnect, to flatten the latency hierarchy just as AMD did going from Rome → Milan → Genoa (which I still need to benchmark).





I think I found a minor bug in Jason Rahman's code for calculating round trip times between CPU cores. Lines 126 to 128 (inside the server function) are:
localTickReqReceived = rdtsc();
data.serverToClientChannel.store(((uint64_t)((uint32_t)(localTickRespSend = rdtsc())) << 32) | (uint64_t)(uint32_t)localTickReqReceived);
Suppose the 64-bit values returned from the two calls to the time stamp counter rdtsc() have the following form:
first rdtsc() call: [32-bit value]FFFFFFFX
second rdtsc() call: [incremented 32-bit value]0000000Y
X and Y are arbitrary 4-bit values.
The lower 32-bits from the two calls are extracted and stored like this: 0x0000000YFFFFFFFX
Lines 93 to 100 (inside the client function) are:
localTickRespReceive = rdtsc();
auto upperBits = (localTickRespReceive & 0xffffffff00000000);
remoteTickRespSend = ((resp & 0xffffffff00000000) >> 32) | upperBits;
remoteTickReqReceive = (resp & 0x00000000ffffffff) | upperBits;
auto offset = (((int64_t)remoteTickReqReceive - (int64_t)localTickReqSend) + ((int64_t)remoteTickRespSend - (int64_t)localTickRespReceive)) / 2;
auto rtt = (localTickRespReceive - localTickReqSend) - (remoteTickRespSend - remoteTickReqReceive);
resp is loaded with 0x0000000YFFFFFFFX in line 88.
(remoteTickRespSend - remoteTickReqReceive) will be the upper 32-bits of resp minus the lower 32-bits of resp, which will be a negative number. This is surely not what was intended. I don't understand the code well enough to suggest a good fix but one idea would be to test if (remoteTickRespSend - remoteTickReqReceive) is negative and add 0x100000000 if it is. This added constant is [incremented 32-bit value] minus [32-bit value] from the two rdtsc() calls mentioned earlier. An alternative is to subtract the two 64-bit values of rdtsc() in the server function and send the lower 32-bits of the difference to the client function. By the way, what is the offset variable and how is it used?
What is (remoteTickRespSend - remoteTickReqReceive) suppose to measure? It looks to me that variability in (remoteTickRespSend - remoteTickReqReceive) is just a result of differences in out-of-order execution of instructions within the server function rather than differences in round trip time. I wonder if it would be better to delete (remoteTickRespSend - remoteTickReqReceive) from the expression for rtt.
I don't think fixing this minor bug will change the results that much. At a core frequency of 2 GHz, there is a carry across the 32-bit boundary of the time stamp counter roughly once every 2 seconds. The chance of the two rdtsc() calls in the server function straddling that seems pretty small.
In both the client and server functions, it may be better to use the newer rdtscp instruction instead of rdtsc. rdtscp is suppose to reduce the variability of measurements on processors that do out-of-order execution. All Xeon processors and all recent consumer processors do out-of-order execution.
Hi Jason, I am confused by the coloring of the heat map. From the single socket 8488 one, it seems to me that the upper left most small tile, 0-11 to 0-11, seems to have the deepest color / meaning largest latency.. is that right? feels counter intuitive.. or am I reading it wrong? Thanks.